
Transportation agencies and the private-sector firms that support them manage large volumes of data every day. Asset inventories, inspection records, work plans, and safety information are collected across programs and jurisdictions. The challenge is not data availability. It is turning that data into information people can use.
Geographic Information Systems (GIS), when paired with effective data visualization, help bridge that gap. For DOTs and transportation contractors responsible for planning, constructing, and maintaining roadway assets, visualization tools provide a clearer picture of conditions, priorities, and risk.
From Data Storage to Decision Support
Many transportation agencies use GIS primarily as a system of record. Assets are mapped, attributes are stored, and layers are maintained for reporting and compliance purposes. While this foundation is important, it does not automatically support day-to-day decisions.
Visualization adds value when it helps users see patterns and relationships that are difficult to identify in spreadsheets or written reports. Mapping asset condition alongside traffic volume, maintenance history, or safety data allows agencies and contractors to better understand where attention is most needed.
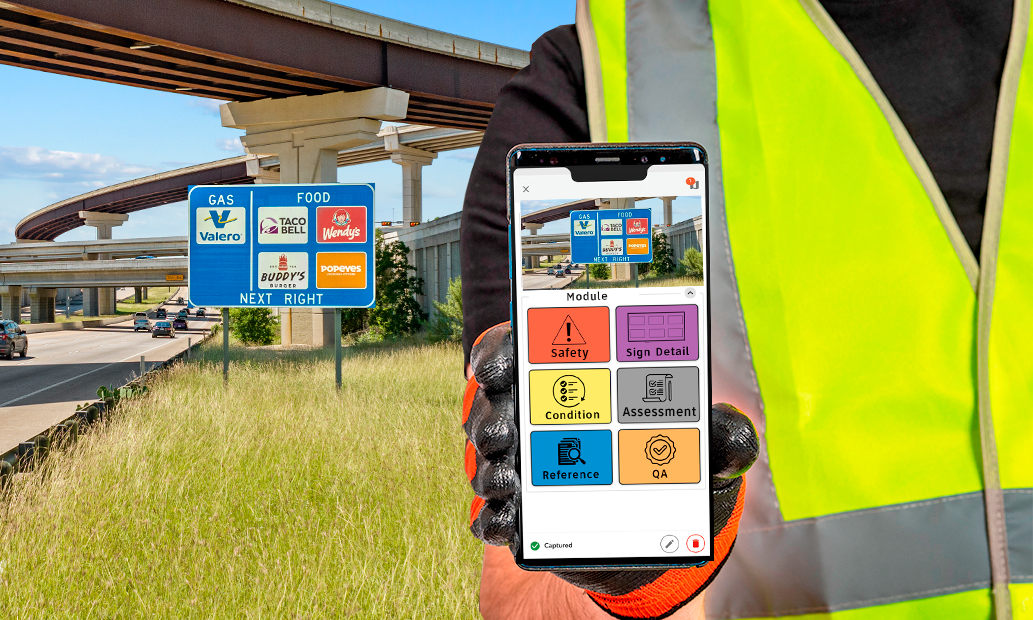
For example, viewing sign condition together with traffic exposure can highlight locations where deterioration has a greater operational or safety impact, helping teams prioritize work more effectively.
Benefits for DOTs
For state and local transportation agencies, GIS-based visualization supports several practical functions:
- Asset management and prioritization
Visual tools can bring together condition, risk, and lifecycle information to support defensible investment decisions. - Work planning and coordination
Mapping planned projects and maintenance activities helps reduce conflicts and improves coordination across programs. - Performance communication
Clear visualizations make it easier to explain system conditions and program outcomes to leadership, policymakers, and the public. - Policy implementation
Spatial views help agencies understand how policies and programs play out across regions, corridors, and communities.
These uses align with federal and state goals for data-driven decision-making, but they depend on how well visualization tools are integrated into existing planning and programming processes.
Benefits for Transportation Contractors
Transportation contractors increasingly rely on spatial information to support both planning and field operations. When GIS-based visualization is accessible and aligned with agency data, it can improve coordination and reduce uncertainty.
Common uses include:
- Bid development and work planning
Spatial context helps contractors better understand asset density, access constraints, and project sequencing. - Field operations and safety
Visualizing work zones, traffic conditions, and nearby assets improves situational awareness for crews and supervisors. - Documentation and quality control
Georeferenced records of inspections and completed work support clear communication and accountability. - Coordination with agencies
Shared visual references reduce misalignment between contract requirements and field conditions.
When DOTs and transportation contractors work from a common spatial understanding, projects tend to run more smoothly.
What Makes Visualization Effective
Not all GIS visualizations are equally useful. Effective efforts typically share a few key characteristics:
- A clear decision purpose
Visuals are designed to support specific decisions, not just to display data. - Reliable data governance
Data sources, update cycles, and ownership are defined so users can trust what they see. - Appropriate level of detail
Visuals provide enough information to inform decisions without overwhelming the user. - Connection to workflow
Visualization tools are part of planning, maintenance, and project delivery processes, not separate from them.
Without these elements, GIS risks becoming a static repository rather than a practical decision-support tool.
A Tool That Improves Visibility
GIS-based data visualization does not replace engineering judgment, policy decisions, or professional experience. It improves visibility. By making conditions and tradeoffs easier to see, it helps DOTs and transportation contractors manage complex systems more proactively.
The value of visualization is not in seeing more data, but in understanding the system more clearly.
References
- Federal Highway Administration (FHWA). Transportation Asset Management Guide
- Federal Highway Administration (FHWA). Data-Driven Safety Analysis and Visualization
- AASHTO. GIS for Transportation (GIS-T): State of the Practice
- National Cooperative Highway Research Program (NCHRP) Report 811. Implementing Transportation Asset Management
- National Cooperative Highway Research Program (NCHRP) Synthesis 446. Use of GIS in Transportation Agencies
- FHWA Office of Planning. Data Integration and Visualization for Transportation Decision-Making
- Transportation Research Board (TRB). Publications on GIS applications in transportation
Want to learn more or inquire about partnering with us?

